Lewin’s Process of Planned Change and Its Use in Creating Infographics
Need help with this assignment?Get an original answer from a qualified tutor — from $10/page.
Get it written →Change projects in nursing, business, education and public health often ask students to explain a planned change visually. One of the most useful frameworks for this task is Kurt Lewin’s process of planned change, commonly described as three stages: unfreezing, changing (moving) and refreezing. Because the model is simple, sequential and easy to picture, it translates naturally into an infographic. This guide explains Lewin’s model, its key concepts and criticisms, and shows step by step how to use it to design a clear, persuasive infographic, with a complete example.
Create awareness and readiness; reduce resistance
Introduce and support new practices
Stabilize the change so it becomes the new norm
Who Was Kurt Lewin?
Kurt Lewin (1890–1947) was a German-American social psychologist often called the founder of social psychology and a pioneer of organizational development. His work on group dynamics, action research and field theory shaped how organizations think about change. His ideas about the stages of change appeared in his 1947 article “Frontiers in Group Dynamics” and were later presented as a three-step model in textbooks (Lewin, 1947; Burnes, 2004).
Lewin’s Process of Planned Change Explained
Lewin saw organizations and groups as existing in a state of quasi-stationary equilibrium: current behavior is held in place by opposing forces. To change behavior, those forces must be shifted. The three stages describe how.
Stage 1: Unfreezing
Unfreezing prepares people for change by disrupting the status quo. People rarely change unless they believe the current situation is unsatisfactory. Leaders create readiness by:
- presenting data that shows a problem (for example, rising infection or fall rates, declining sales or poor test scores);
- sharing stories that make the problem real;
- explaining the benefits of change and the risks of doing nothing;
- involving stakeholders early to reduce fear and build ownership.
Stage 2: Changing (Moving)
In the changing stage, people learn and adopt new behaviors, processes or systems. This stage is often uncomfortable and requires support, including:
- training and education;
- clear communication about what is changing and why;
- role models, champions and coaching;
- pilot testing and quick problem-solving.
Stage 3: Refreezing
Refreezing stabilizes the change so people do not slip back into old habits. Leaders reinforce the new state by:
- updating policies, procedures and job descriptions;
- building the change into orientation and performance expectations;
- monitoring results and sharing successes;
- recognizing and rewarding people who adopt the change.
Force Field Analysis
Lewin also developed force field analysis, a tool for identifying the forces that support or oppose change. Driving forces push toward change, such as patient safety concerns, leadership support or new regulations. Restraining forces resist change, such as heavy workloads, fear, habits or lack of resources. Change happens when driving forces are strengthened and, more effectively, when restraining forces are reduced. Force field analysis fits naturally into the unfreezing stage and is easy to show visually as opposing arrows.
Strengths and Criticisms of Lewin’s Model
| Strengths | Criticisms |
|---|---|
| Simple, logical and easy to communicate | Viewed as too linear for complex, fast-changing organizations |
| Emphasizes preparing people, not just changing systems | “Refreezing” may seem unrealistic where continuous change is the norm |
| Force field analysis gives a practical diagnostic tool | Gives limited detail on how to carry out the changing stage |
| Widely used in nursing and health care change projects | Scholars note the tidy three-step version was largely shaped by later writers, not Lewin himself (Cummings et al., 2016) |
Despite these criticisms, Lewin’s model remains one of the most widely taught change frameworks because it captures a basic truth: successful change requires preparing people, supporting them through the transition and reinforcing the new way of working (Hussain et al., 2018). It is often compared with or combined with Kotter’s 8-step model, which expands the same logic into more detailed steps.
Why Use Lewin’s Model to Create an Infographic?
An infographic combines text, images, icons and data to communicate information quickly. Lewin’s model is ideal for infographics because:
- It has a natural sequence. Three stages create a clear visual flow from top to bottom or left to right.
- It is easy to remember. “Unfreeze, change, refreeze” works as a visual metaphor, such as melting and reshaping ice.
- It connects the “why” and the “how.” The unfreezing stage presents the problem and data; the changing and refreezing stages show the action plan.
- Force field analysis is visual by nature. Arrows pushing in opposite directions communicate driving and restraining forces instantly.
- It persuades stakeholders. Staff, managers and committees can see the whole plan on one page.
Step-by-Step: Creating an Infographic Using Lewin’s Model
Step 1: Define the change and the audience
State the change in one sentence (for example, “Implement purposeful hourly rounding to reduce patient falls”) and identify the audience: frontline staff, managers, patients or a course instructor. The audience determines the language, level of detail and visuals.
Step 2: Gather data for the “unfreeze” section
Collect two or three powerful facts that show why change is needed, such as local rates, costs or patient outcomes, and cite them. Numbers displayed as large “stat callouts” grab attention.
Step 3: Complete a force field analysis
List three or four driving forces and three or four restraining forces, and plan how to reduce the restraining forces. These lists become a two-column visual.
Step 4: Plan actions for each stage
Write two to four short, specific action bullets for each stage. Keep each bullet under about 12 words.
Step 5: Choose a layout
- Vertical timeline: stages stacked from top to bottom (works well for posters and printed handouts).
- Horizontal flow: three columns with arrows (works well for slides).
- Ice metaphor: an ice cube (unfreeze), water (change) and a new ice shape (refreeze).
- Staircase: steps rising toward the goal.
Step 6: Apply design principles
- Use one color per stage and keep the palette to three or four colors.
- Choose readable fonts and large headings; limit text.
- Use consistent icons, such as a thermometer, gears or a check mark.
- Leave white space so the page does not feel crowded.
- Ensure accessibility: strong color contrast, text labels (not color alone) and alt text if posted online.
Step 7: Add evaluation and sources
Include a “How we will know it worked” section with measurable outcomes and a small reference line at the bottom with citations for any data.
Step 8: Build, review and refine
Tools such as Canva, Piktochart, Venngage, Microsoft PowerPoint or Google Slides work well. Ask a colleague to review it: can they explain the plan in 30 seconds? If not, simplify.
Example Infographic: Hourly Rounding to Prevent Falls
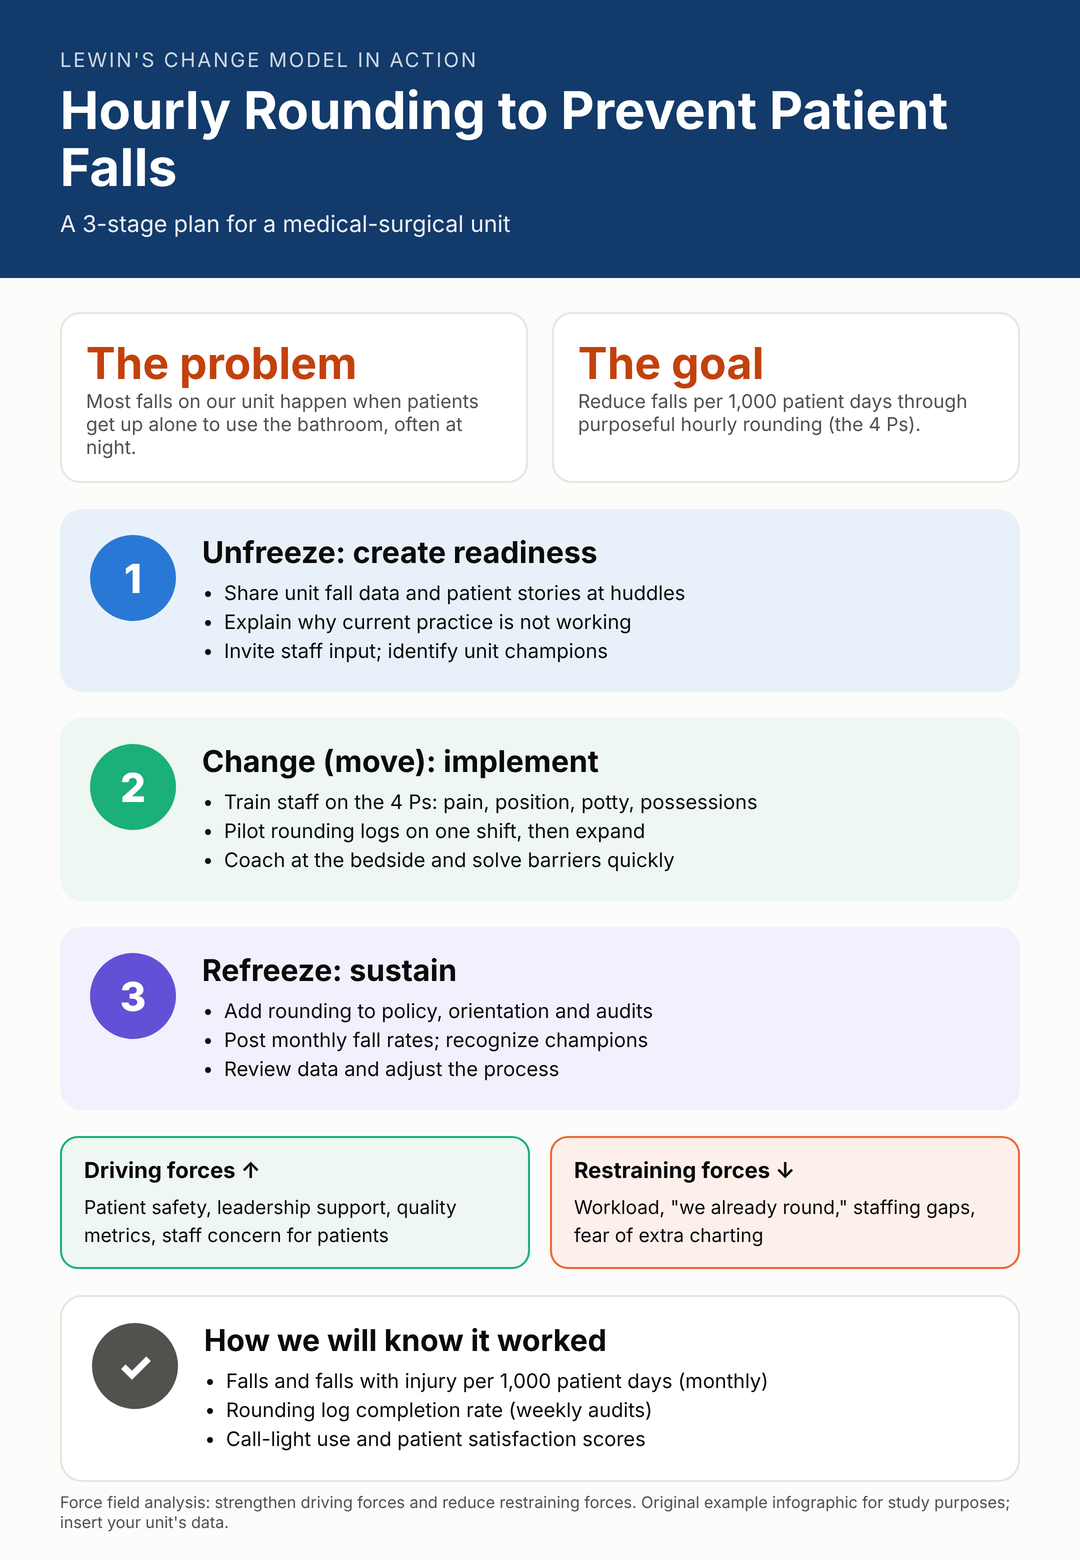
This example shows how each part of Lewin’s model becomes a section of the infographic: the problem and goal open the unfreezing stage; three color-coded stages show the plan; a force field analysis highlights what will help or hinder the change; and an evaluation box shows how success will be measured.
Infographic Content Template
Title: [Name of the change] using Lewin’s Change Model
Problem (1–2 stats): [data showing why change is needed]
Goal: [measurable outcome]
Unfreeze: [2–3 actions to create readiness]
Change: [2–3 actions to implement]
Refreeze: [2–3 actions to sustain]
Driving forces / Restraining forces: [3–4 each]
Evaluation: [2–3 measures with frequency]
References: [citations in small font]
Common Mistakes to Avoid
- Writing paragraphs instead of short phrases.
- Skipping the “why”: an infographic without data in the unfreeze stage is not persuasive.
- Treating refreezing as an afterthought; sustainability is what makes change last.
- Using too many colors, fonts or decorative images.
- Forgetting to cite data sources or to include measurable outcomes.
Frequently Asked Questions
What are the three stages of Lewin’s change model?
Unfreezing (preparing for change), changing or moving (implementing new behaviors) and refreezing (stabilizing the change as the new norm).
What is the difference between Lewin’s and Kotter’s models?
Lewin’s model has three broad stages and focuses on the forces for and against change. Kotter’s model has eight detailed steps, such as creating urgency, forming a coalition and generating short-term wins, which can be seen as expanding Lewin’s stages.
Can I use Lewin’s model for a nursing change project?
Yes. It is one of the most commonly used frameworks in nursing for evidence-based practice and quality improvement projects, such as new protocols, documentation systems or safety initiatives.
How long should an infographic be?
Follow your assignment instructions. Most single infographics fit on one page or one poster; some assignments allow two to three pages.
References
Burnes, B. (2004). Kurt Lewin and the planned approach to change: A re-appraisal. Journal of Management Studies, 41(6), 977–1002. https://doi.org/10.1111/j.1467-6486.2004.00463.x
Cummings, S., Bridgman, T., & Brown, K. G. (2016). Unfreezing change as three steps: Rethinking Kurt Lewin’s legacy for change management. Human Relations, 69(1), 33–60. https://doi.org/10.1177/0018726715577707
Hussain, S. T., Lei, S., Akram, T., Haider, M. J., Hussain, S. H., & Ali, M. (2018). Kurt Lewin’s change model: A critical review of the role of leadership and employee involvement in organizational change. Journal of Innovation & Knowledge, 3(3), 123–127. https://doi.org/10.1016/j.jik.2016.07.002
Lewin, K. (1947). Frontiers in group dynamics: Concept, method and reality in social science; social equilibria and social change. Human Relations, 1(1), 5–41. https://doi.org/10.1177/001872674700100103
Related reading: change frameworks and Kotter’s 8 steps, designing an infographic as a nurse manager, how to be an effective change agent and EBP question development for a falls project.
Get a plagiarism-free answer to this question
Send us your instructions and we’ll match you with the best writer in your subject.
- 100% human-written, zero AI
- Turnitin report included
- Confidential — we never share your data
- Free revisions & refunds